[10-minute read]
Like many cities around the world, London, Canada, has a problem with drivers who dangerously cut through neighbourhoods.
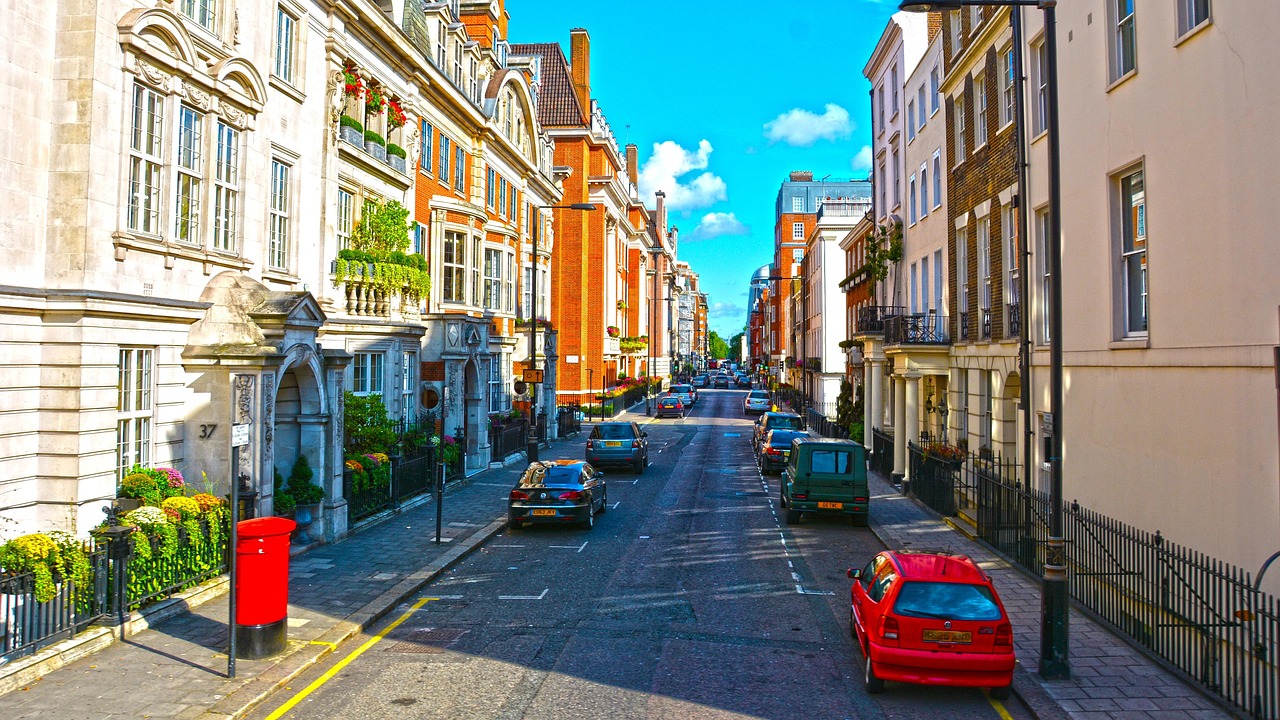
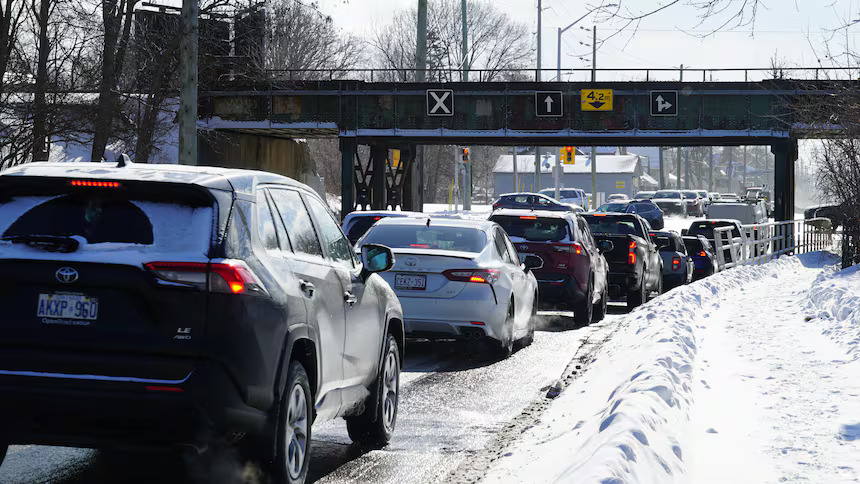
As London’s population has grown, so too has its traffic volume. Thus, it’s no surprise that frustrated drivers in heavy traffic on arterial roads are taking shortcuts, or “rat running,” through quiet London neighbourhoods that were never designed to be thoroughfares.
While it may save a little time for the driver, it increases local traffic and makes small neighbourhood streets more treacherous.

(Photo credit: Eluj, from Pixabay)
For the average Londoner, what are the consequences of people rushing around in cars?
- an increase in collisions involving people walking, biking, and driving, and even crashing into buildings
- an increase in air pollution, a decrease in residents’ quality of life, and a reduction in people using active transportation, such as walking or cycling
So, what can be done to make our neighbourhoods safer? To answer that, we need to look at what cities in the UK have done to combat the same issues.
Low Traffic Neighbourhoods in the UK
Since the 1960s, towns and cities in the United Kingdom have designated certain residential areas as Low Traffic Neighbourhoods (LTNs). These are areas in which both “filtered permeability” and “traffic calming” measures are deployed to reduce motorized through-traffic (think bollards, barriers, and bumps).
Obviously, the Brits have gained a lot of experience with this over the years. In fact, even before the pandemic, they had already established at least 25,000 modal filters across the UK.
Modal filters are barriers that prevent some modes of traffic, for example, automobiles, from passing through barriers, but allow other modes of traffic, such as pedestrians and bicycles, to pass through easily.
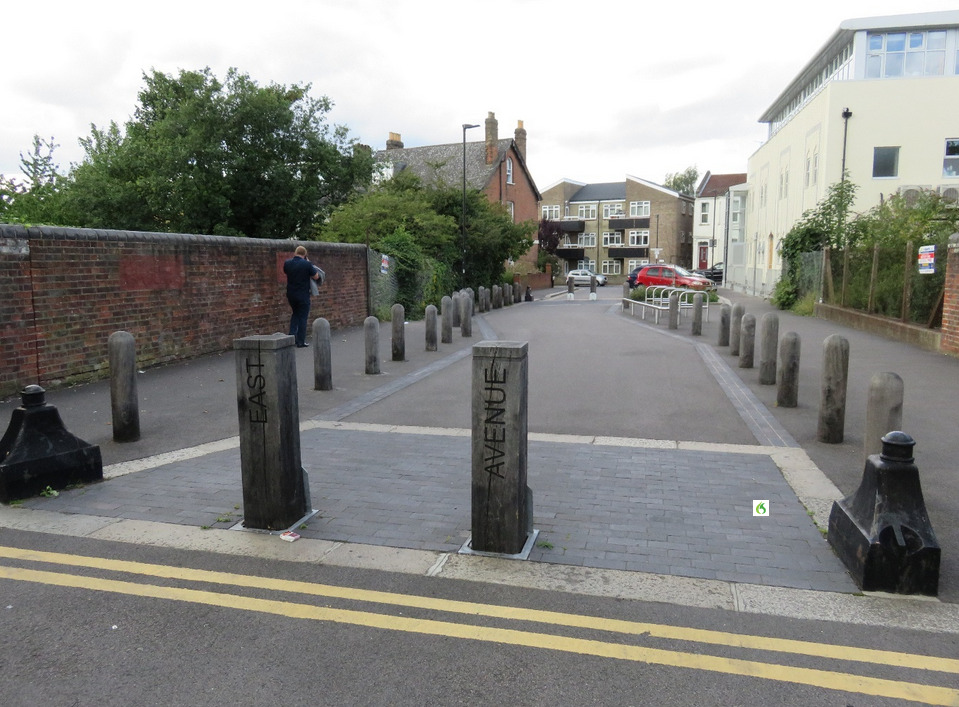
(Photo credit: Rachel Aldred)
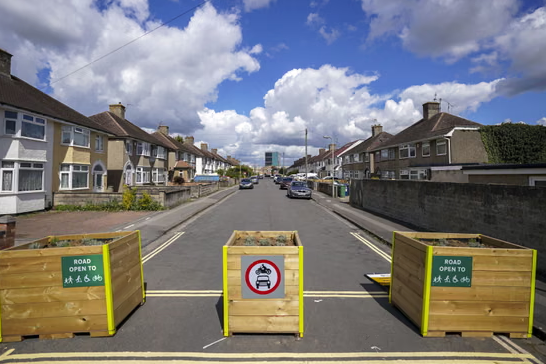
(Photo credit: Steve Parsons)
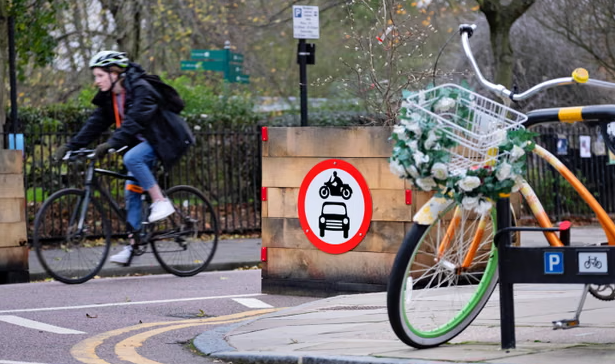
(Photo credit: Linda Nylind/The Guardian)
Starting in the spring of 2020, at the beginning of the pandemic, London rolled out an additional seventy-two LTNs with modal filters across the city, covering a population of around 300,000 people.
Obviously, this was NOT a small undertaking.
Do LTNs actually work?
Yep!
Research conducted over the last five years found a decrease in traffic volume, nitrogen dioxide pollution, injuries, and even crime after LTNs were implemented.
They also found an increase in active travel, such as walking and bicycling.
You can find the results from numerous recent research studies in a large chart at the end of this article.
Does anyone object to LTNs?
Yes, of course, there will always be naysayers. It’s normal to fear change.
Common objections to Low Traffic Neighbourhoods include:
- the cost of implementation
- lack of consultation
- speculation that the issue would affect election results
- increased traffic on “boundary roads” (this is UK terminology), we use the term “arterial roads” in Canada.
Here is what the studies found:
- There was no evidence that traffic increased significantly on boundary roads when compared with control roads in the same area.1, 2, 3, 4, 5
- Likewise, there was no evidence that emergency vehicle response times were negatively affected inside LTNs, and some evidence that they improved slightly on boundary roads.14
- As for affecting election results, the doomsday predictions that candidates in favour of LTNs would lose badly never came to pass. In fact, the opposite occurred. 15, 16, 17, 18, 19
- And finally, in a 2023 survey of residents of trial LTN areas, twice as many supported the schemes as opposed them.5
Yay! Success!
It turns out that most of the concerns listed earlier were unfounded.
What is London, Canada, currently doing?
Right now, the City of London uses the following traffic calming measures to reduce both motor vehicle speeds and traffic volumes:
- Vertical measures, such as speed cushions and raised intersections/ crosswalks
- Horizontal measures, such as on-street parking, curb extensions/ road narrowing, mini roundabouts, centre islands, and in-road flexible signs
- Passive measures, such as pavement markings, “Respect the Limit” lawn signs, and speed display boards
While these traffic calming measures may have some success in reducing vehicle speeds, they are less helpful in reducing traffic volumes. That’s why modal filters are so beneficial, as illustrated by the UK examples given above.
London, Ontario, already uses modal filters, such as the one at Empress and Rathnally, to great effect (see below). Cut-through traffic on these streets has been completely eliminated.
Huh? It’s almost like street design can be 100% effective if implemented properly.
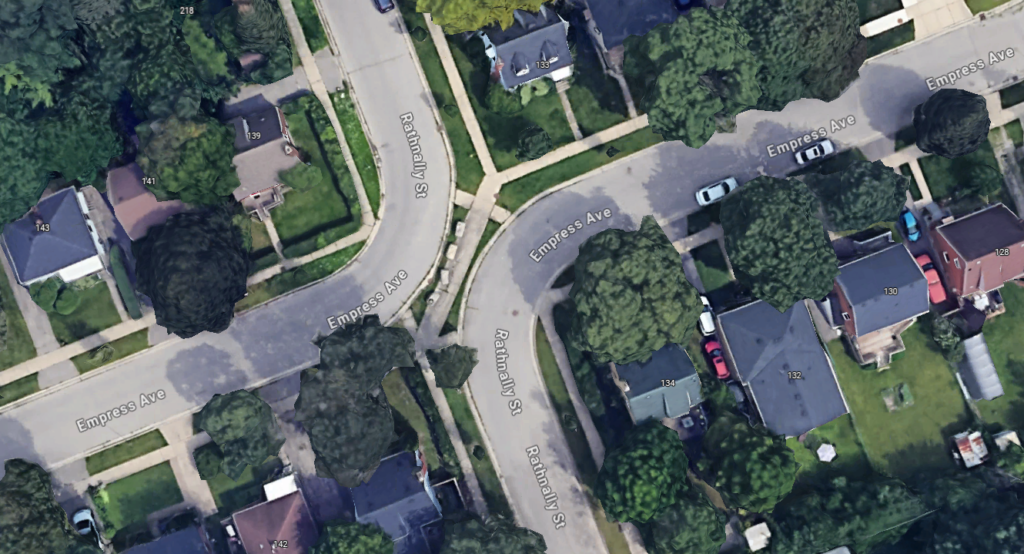
(Source: Google Maps)
Despite this isolated example, the city of London has not yet blocked off any neighbourhoods or other specified large areas as part of a comprehensive Low Traffic Neighbourhood. It has only done small street-by-street changes, scattered throughout the city.
What are the next steps for London, Canada?
As the city grows, so does the need for innovative ways to deal with increased traffic volumes and rat-running behaviour. Hopefully, London can take note of the lessons learned in London, UK, and start making use of LTNs with modal filters in a bigger way.
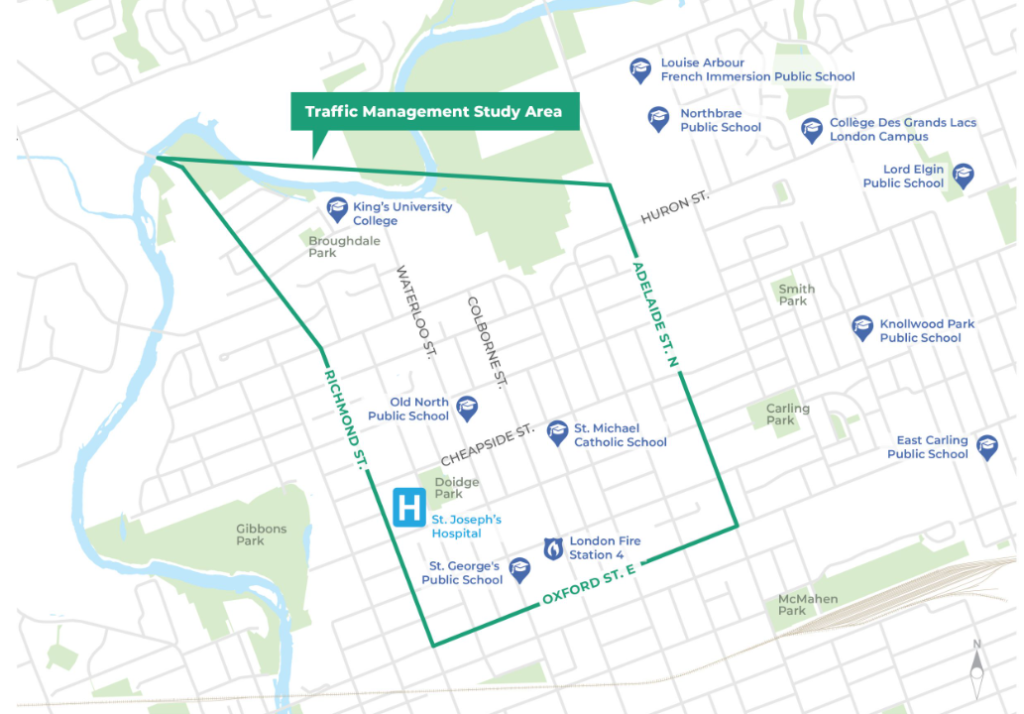
(source: Get Involved London)
The way forward may not be an easy path for London City Councillors to trod, as the pressure from noisy dissenters who want to maintain the status quo can be very persuasive… especially if their arguments sound reasonable at the surface. But when you dive deeper, you quickly realize that LTNs are a solution to the problems that many residents complain about on a routine basis.
Given adequate public education, consultation with residents, and the lessons learned from our sister city in the UK, we’re confident that London, Canada, will soon have quieter, safer neighbourhoods that are more walkable and resilient.
Now, THAT’S something we can ALL get behind.
LTN results
As promised, these are results of recent studies…
| Decrease in traffic: | Inside the Waltham Forest LTN, roads saw an average 44.1% reduction in traffic.1 A 2022 study of three LTNs in Islington Borough found a 58.2% decrease in traffic.2 In three LTN areas in Southwark, traffic speeds decreased.3 A systematic review and meta-analysis of 46 LTNs introduced between May 2020 and May 2021 in 11 London boroughs showed that car traffic within the zones almost halved.4 A 2023 Department for Transport review found that LTNs were effective in achieving outcomes of reducing traffic volumes within their zones.5 |
| Decrease in nitrogen dioxide: | A 2022 study found that LTNs reduced nitrogen dioxide levels by 5.7% at internal sites, and by 8.9% at boundary sites.2 |
| Decrease in injuries: | Within two LTN areas introduced between 2015 and 2019 (after extensive consultation and with significant engineering improvements), the number of injuries and the risk of injury per trip decreased by about 70% for walkers, cyclists, and car occupants.6 Of the 72 LTNs introduced in London in 2020 (which were more hastily established with relatively few engineering measures), the injury rates (especially pedestrian injuries) were halved on roads within the LTN zones.7 A June 2025 research study compared over a decade of road casualty statistics from 113 London LTNs and found a 35% reduction in all injuries, with a 37% reduction in deaths and serious injuries. This equated to over 600 prevented road injuries, including 100 involving death or serious injury.8 |
| Decrease in crime: | The introduction of LTNs led to a decrease in total street crime. After 3 years of implementation, a 2021 study found an 18% decrease in street crime in LTN areas. A larger reduction was found for violent crimes and sexual assaults. Only a single subcategory for crime saw an increase: bicycle theft.9, 10 |
| Increase in active travel: | LTNs tend to encourage more active travel, shifting people from car use towards walking and/ or cycling.11, 12, 13 |

Lawrence Durham is a member of Strong Towns London, where he regularly engages in local conversations about how to improve the city, including the use of modal filters to create quiet, walkable neighbourhoods. Lawrence is a cheerful, unapologetic optimist known for being relentlessly curious about London and writing about all the amazing things he finds happening in the city he calls home. In addition to running London Bicycle Tours, you may see him riding around the city in all four seasons. Yes, even during our cold Canadian winters!
References
- Walthamstow Village Review. Project Centre; Enjoy Waltham Forest. Retrieved 27 November 2022
- Yang, Xiuleng; McCoy, Emma; Hough, Katherine; de Nazelle, Audrey (December 2022). “Evaluation of low traffic neighbourhood (LTN) impacts on NO2 and traffic”. Transportation Research Part D: Transport and Environment. 113 103536. doi:10.1016/j.trd.2022.103536. hdl:10044/1/101078.
- Xiao, Christina S.; Sinclair, Nikita; Saunders, Lucy; Panter, Jenna (November 2023). “Evaluating the impact of low traffic neighbourhoods in areas with low car ownership: A natural experimental evaluation”. Journal of Transport & Health. 33 101658. doi:10.1016/j.jth.2023.101658.
- Thomas, Asa; Aldred, Rachel (March 2024). “Changes in motor traffic in London’s Low Traffic Neighbourhoods and boundary roads”. Case Studies on Transport Policy. 15 101124. doi:10.1016/j.cstp.2023.101124.
- Walker, Peter (8 March 2024). “Rishi Sunak’s report finds low-traffic neighbourhoods work and are popular”. The Guardian. Retrieved 8 March 2024.
- Laverty, Anthony A; Aldred, Rachel; Goodman, Anna (11 January 2021). “The Impact of Introducing Low Traffic Neighbourhoods on Road Traffic Injuries”. Findings. doi:10.32866/001c.18330. hdl:10044/1/91988.
- Goodman, Anna; Furlong, Jamie; Laverty, Anthony A.; Thomas, Asa; Aldred, Rachel (22 July 2021). “Impacts of 2020 Low Traffic Neighbourhoods in London on Road Traffic Injuries”. Findings. doi:10.32866/001c.25633. hdl:10044/1/91978.
- Walker, Peter (2025-07-07). “London’s low-traffic zones ‘cut deaths and injuries by more than a third’”. The Guardian. ISSN 0261-3077. Retrieved 2025-07-07.
- Goodman, Anna; Aldred, Rachel (13 January 2021). “The Impact of Introducing a Low Traffic Neighbourhood on Street Crime, in Waltham Forest, London” (PDF). doi:10.31235/osf.io/ftm8d.
- “Police urge against scrapping low traffic neighbourhood, saying it reduces crime”. road.cc. 2023-02-11. Retrieved 2026-01-23.
- Aldred, Rachel; Goodman, Anna (10 September 2020). “Low Traffic Neighbourhoods, Car Use, and Active Travel: Evidence from the People and Places Survey of Outer London Active Travel Interventions”. Findings. doi:10.32866/001c.17128.
- Aldred, Rachel; Goodman, Anna; Woodcock, James (March 2024). “Impacts of active travel interventions on travel behaviour and health: Results from a five-year longitudinal travel survey in Outer London”. Journal of Transport & Health. 35 101771. doi:10.1016/j.jth.2024.101771
- Aldred, Rachel; Goodman, Anna (16 March 2021). “The Impact of Low Traffic Neighbourhoods on Active Travel, Car Use, and Perceptions of Local Environment during the COVID-19 Pandemic”. Findings. doi:10.32866/001c.21390. S2CID 233709772.
- Goodman, Anna; Laverty, Anthony A; Aldred, Rachel (15 December 2020). “The Impact of Introducing a Low Traffic Neighbourhood on Fire Service Emergency Response Times, in Waltham Forest London”. Findings. doi:10.32866/001c.18198. hdl:10044/1/91991. S2CID 230596381.
- “Results 2021 | London Elects”. www.londonelects.org.uk. Retrieved 2022-01-30.
- “Hoxton East & Shoreditch by-election 2021: All your candidates in one place”. Hackney Citizen. 2021-04-26. Retrieved 2022-01-30.
- “By-elections | Hackney Council”. hackney.gov.uk. Retrieved 2022-01-30.
- Reporter, Julia Gregory Local Democracy (2022-03-07). “Islington consulted on future of low traffic neighbourhoods”. Islington Gazette. Retrieved 2022-03-19.
- “By elections | Islington Council”. www.islington.gov.uk. Retrieved 2022-03-19.
This article was peer reviewed by Sandra Miller, Ben Durham, and Charlene Jimmo.


.jpg)